
|
|
|||||||
| The Internet Web sites, web development, email, chat, bandwidth, the net and society |
|
|
Thread Tools | Display Modes |
 05-22-2018, 05:58 PM
|
#10 |
|
Radical Centrist
Join Date: Jan 2001
Location: Cottage of Prussia
Posts: 31,423
|
But IMO that's a silly way to look at the data, since the number would be higher than the 1951-1980 average for 400 months if it rose a teeny bit 400 months ago, and then stayed constant.
Also, the 1951-80 data is weaker and is missing large parts of the earth. And I believe it's land-only? I think, I dunno. The best way to look at it, again IMO, is to consider only the post-1980 temperatures, as they are much more accurate than anything pre-1980, because that is when the satellites took over the job. The best way to watch those temperatures is by following the UAH6.0 lower troposphere reported temps, a graph of which currently looks like this (an interesting graph, so it's pertinent to the thread): 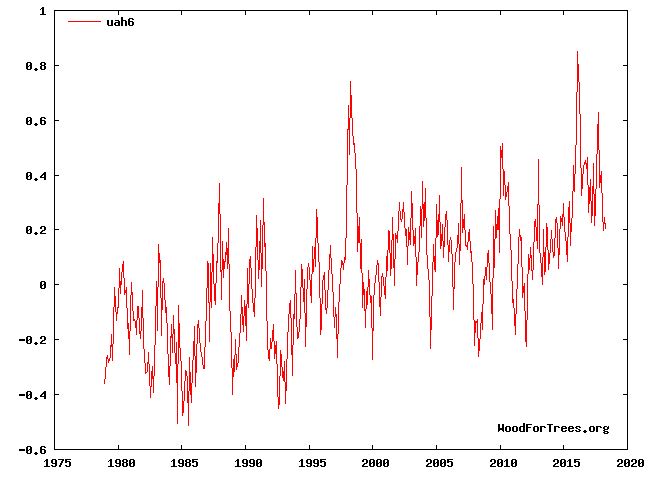 That way you are only looking at satellite numbers and comparing them to satellite numbers. The satellites do make mistakes (they drift), and some of this data has been corrected for, but it's considered pretty accurate. The "anomaly" here, the number being graphed, is the temp versus the 1980 average. So, in April 2018, the |

|

|
| Currently Active Users Viewing This Thread: 2 (0 members and 2 guests) | |
|
|


 Threaded Mode