Quote:
Originally Posted by Spexxvet

Deficit and debt are not the same thing
|
Yeah, well, the debt graph is boring. It just keeps going up exponentially. The deficit graph is where the real data is, because you can see how government policy and economic factors work together to increase the debt slightly or rapidly.
One interesting thing is that the debt was much worse in the 80s because interest rates were higher then, so a bigger slice of the federal budget pie had to be spent paying interest back then than it does now. So we have a much bigger debt now, but it doesn't matter as much as it did during the Reagan years.
Quote:
|
The real risk from government debt is the burden of interest payments. Experts say that when interest payments reach about 12% of GDP then a government will likely default on its debt. Chart 4.05 shows that the US is a long way from that risk. The peak period for government interest payments, including federal, state, and local governments, was in the 1980s, when interest rates were still high after the inflationary 1970s. Of course, the numbers don’t show the burden of interest payments from Government Sponsored Enterprises like Fannie Mae and Freddie Mac.
|
Look at the green in this chart. That's what the federal government has to pay in interest.
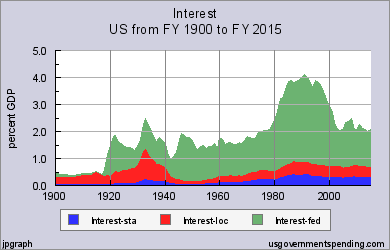
edit: Actually, I misspoke. That's the interest the federal government has to pay, expressed as a percentage of GDP.

 10-11-2013, 09:26 AM


 Threaded Mode