
|
 05-22-2018, 02:28 PM
|
#1786 |
|
Radical Centrist
Join Date: Jan 2001
Location: Cottage of Prussia
Posts: 31,423
|
'member when we had snow last month, that was that happening |

|

|
|
05-22-2018, 03:33 PM
|
#1787 |
|
The Un-Tuckian
Join Date: Apr 2007
Location: South Central...KY that is
Posts: 39,517
|
How does the "400 months in a row" work into that?
Is it "400 months in a row", or is it April? Or, is it 400 Aprils in a row?
__________________
 These statements have not been evaluated by the FDA, EPA, FBI, DEA, CDC, or FDIC. These statements are not intended to diagnose, cause, treat, cure, or prevent any disease. If you feel you have been harmed/offended by, or, disagree with any of the above statements or images, please feel free to fuck right off. |
|
|
|
|
05-22-2018, 03:35 PM
|
#1788 |
|
The Un-Tuckian
Join Date: Apr 2007
Location: South Central...KY that is
Posts: 39,517
|
And what does the temperature of my gis have to do with anything?
__________________
These statements have not been evaluated by the FDA, EPA, FBI, DEA, CDC, or FDIC. These statements are not intended to diagnose, cause, treat, cure, or prevent any disease. If you feel you have been harmed/offended by, or, disagree with any of the above statements or images, please feel free to fuck right off. |
|
|
|
|
05-22-2018, 03:36 PM
|
#1789 | |
|
The future is unwritten
Join Date: Oct 2002
Posts: 71,105
|
Quote:
__________________
The descent of man ~ Nixon, Friedman, Reagan, Trump. |
|
|
|
|
|
05-22-2018, 03:37 PM
|
#1790 |
|
The Un-Tuckian
Join Date: Apr 2007
Location: South Central...KY that is
Posts: 39,517
|
Fuck weather vs climate...
What does the goddamned chart indicate?
__________________
These statements have not been evaluated by the FDA, EPA, FBI, DEA, CDC, or FDIC. These statements are not intended to diagnose, cause, treat, cure, or prevent any disease. If you feel you have been harmed/offended by, or, disagree with any of the above statements or images, please feel free to fuck right off. |
|
|
|
|
05-22-2018, 03:37 PM
|
#1791 |
|
The Un-Tuckian
Join Date: Apr 2007
Location: South Central...KY that is
Posts: 39,517
|
Fiukkit, Im too pissed to learn anything rfn.
__________________
These statements have not been evaluated by the FDA, EPA, FBI, DEA, CDC, or FDIC. These statements are not intended to diagnose, cause, treat, cure, or prevent any disease. If you feel you have been harmed/offended by, or, disagree with any of the above statements or images, please feel free to fuck right off. |
|
|
|
|
05-22-2018, 03:38 PM
|
#1792 |
|
The future is unwritten
Join Date: Oct 2002
Posts: 71,105
|
The climate is changing to warmer and that's not good.
__________________
The descent of man ~ Nixon, Friedman, Reagan, Trump. |
|
|
|
|
05-22-2018, 04:06 PM
|
#1793 |
|
UNDER CONDITIONAL MITIGATION
Join Date: Mar 2004
Location: Austin, TX
Posts: 20,012
|
The "400 months" is that this is the 400th month in a row that overall world temperatures have been higher than average.
|
|
|
|
|
05-22-2018, 05:58 PM
|
#1794 |
|
Radical Centrist
Join Date: Jan 2001
Location: Cottage of Prussia
Posts: 31,423
|
But IMO that's a silly way to look at the data, since the number would be higher than the 1951-1980 average for 400 months if it rose a teeny bit 400 months ago, and then stayed constant.
Also, the 1951-80 data is weaker and is missing large parts of the earth. And I believe it's land-only? I think, I dunno. The best way to look at it, again IMO, is to consider only the post-1980 temperatures, as they are much more accurate than anything pre-1980, because that is when the satellites took over the job. The best way to watch those temperatures is by following the UAH6.0 lower troposphere reported temps, a graph of which currently looks like this (an interesting graph, so it's pertinent to the thread): 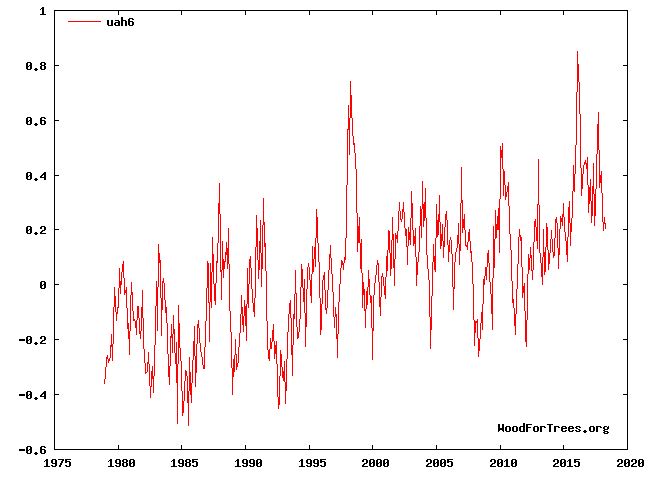 That way you are only looking at satellite numbers and comparing them to satellite numbers. The satellites do make mistakes (they drift), and some of this data has been corrected for, but it's considered pretty accurate. The "anomaly" here, the number being graphed, is the temp versus the 1980 average. So, in April 2018, the |
|
|
|
|
05-22-2018, 07:03 PM
|
#1795 |
|
I think this line's mostly filler.
Join Date: Jan 2003
Location: DC
Posts: 13,575
|
It looks like 1980 was a high point of a cycle, and the graph ends on a low point. So the low point of a roughly +/- 0.2 degree cycle now is 0.2 degrees over the high point of the cycle 40 years ago. It would be easier to see what's happening if there were a trendline plotted through the datapoints.
edit accuracy: high point of probably 1981 was closer to 0.1 than 0; current low point is 0.1 degrees higher than that.
__________________
_________________ |...............| We live in the nick of times. | Len 17, Wid 3 | |_______________| [pics] |
|
|
|
|
05-23-2018, 02:22 PM
|
#1796 |
|
The Un-Tuckian
Join Date: Apr 2007
Location: South Central...KY that is
Posts: 39,517
|
What does the blue over eastern North America indicate?
__________________
These statements have not been evaluated by the FDA, EPA, FBI, DEA, CDC, or FDIC. These statements are not intended to diagnose, cause, treat, cure, or prevent any disease. If you feel you have been harmed/offended by, or, disagree with any of the above statements or images, please feel free to fuck right off. |
|
|
|
|
05-23-2018, 02:26 PM
|
#1797 | |
|
Join Date: Jul 2003
Location: Arlington, VA
Posts: 27,717
|
Quote:

|
|
|
|
|
|
05-23-2018, 02:31 PM
|
#1798 |
|
The Un-Tuckian
Join Date: Apr 2007
Location: South Central...KY that is
Posts: 39,517
|
Well thar's m'prollum right thar!
__________________
These statements have not been evaluated by the FDA, EPA, FBI, DEA, CDC, or FDIC. These statements are not intended to diagnose, cause, treat, cure, or prevent any disease. If you feel you have been harmed/offended by, or, disagree with any of the above statements or images, please feel free to fuck right off. |
|
|
|
|
05-23-2018, 03:10 PM
|
#1799 | |
|
Radical Centrist
Join Date: Jan 2001
Location: Cottage of Prussia
Posts: 31,423
|
Quote:
|
|
|
|
|
|
05-24-2018, 12:35 PM
|
#1800 |
|
Turns out my CRS is a symptom of TMB.
Join Date: Jan 2010
Location: Chicago suburbs
Posts: 2,916
|
__________________
   Talk nerdy to me. |
|
|
|
 |
| Currently Active Users Viewing This Thread: 1 (0 members and 1 guests) | |
|
|


 Linear Mode

